Blog
September 30, 2024

Debugging PHP is crucial for maintaining efficient and reliable web applications. It helps identify and fix issues like syntax errors, undefined variables, and performance bottlenecks while offering insights into execution time, memory usage, and database queries. However, creating a strategy for debugging PHP can also be challenging.
In this blog, I walk through the basics of debugging PHP and cover traditional methods used by developers. I then explore available debugging tools, including all the features supplied by ZendHQ and Z-Ray.
Debugging PHP: Overview
Debugging PHP helps developers inspect code and provides detailed information on execution time and memory consumption while also identifying bottlenecks and other critical issues.
What Is Debugging in PHP?
Debugging in PHP is a combination of techniques and tools used by developers to identify and fix issues in source code.
Debugging PHP can also include discovering and solving bad performance in the execution of the PHP app. It involves systematically examining code, tracing its execution, profiling database queries, and identifying the root cause of the issue. With a solid understanding of techniques for debugging PHP and the appropriate use of available tools, developers can write better code, developing robust, performant, and scalable PHP applications.
Is PHP Hard to Debug?
Yes, PHP can be hard to debug, depending on your application. However, there are several techniques and some tools that can help.
These PHP debugging tools and techniques range from simple to use to more complex options for more structured processes.
The choice of technique for debugging PHP may depend on the complexity of the code and developer goals. The more complex the PHP application, the more complicated it will be to debug. Debugging complex and structured PHP applications to find bottlenecks and performance issues, for example, could require a combination of techniques, tools, and a very experienced developer with solid experience and problem-solving skills.
Back to topTraditional Techniques and Tools for Debugging PHP
Many techniques are available for developers working on debugging PHP. Some are more known than others, but I'll walk through a few of the most commonly used debugging methods for PHP here.
stdout
The simplest PHP debugging technique, and one of the most commonly adopted, is to output values directly to the browser or console by dumping variables to stdout. Developers can use the echo or print statements to display the values of variables, function returns, or other information of the code. Here is a list of other native functions for debugging PHP:
- print_r ($var) prints the variable value in a human-readable form to stdout
- var_dump ($var) dumps the variable type and value to stdout
- debug_print_backtrace(),debug_backtrace() prints and get backtrace of the execution code
View Errors Directly in the Browser
PHP allows you to view errors directly in the browser by setting the error_reporting() option. You can enable error display in the configuration file php.ini or directly in the PHP script.
Error Log
Debugging PHP can be completed through the error log by using a native PHP function like error_log() or by setting the directive php.ini "error_log" in order to generate the file that contains error messages generated by PHP scripts. There are also some tools or libraries that can interpret and show the messages with different levels of aggregation.
Web Tool Bars
Debug PHP by using the Web Tool Bar supplied by some frameworks or libraries (such as Laravel, Symfony, and Laminas). These tools show metrics and report about performance, database queries, routed URLs, and more. However, they are usually modules or plugins related and tied to the specific framework.
Inspection Functionalities Included in IDEs
Debugging PHP can be completed through profiling and inspection functionalities supplied by some Integrated Development Environments (IDE). These processes can significantly reduce the time needed to fix some bugs, like parser errors, syntax errors, undefined variables, or code-style editors, as they are able to be immediately reported in the editor of the IDE.
Xdebug and Step Debuggers
Xdebug PHP extensions are powerful options that offer a lot of features for debugging PHP, such as debugging by step. These extensions include stack trace, profiling, and code coverage. Xdebug is an open-source project that is one of the most known PHP debugging tools, and it is widely integrated with PHP IDEs like PhpStorm, Visual Code, and Eclipse.
Installing Xdebug debugger, profiler, and tracer requires some manual installation, which may not "just work" in several configurations, and it could require manual compilation with sometimes non-obvious reconfigurations.
Back to topDebugging PHP With Traditional Step Debuggers
Traditional step debuggers, such as Xdebug, debug PHP through a process called "stepping." Stepping is the process of controlling step-by-step execution of the program. Step debuggers allow developers to analyze the state of the program and related data before and after execution of each line of code by inspecting variables and functions. In a traditional step debugger, we have the following functionality:
- breakpoints — Placing breakpoints at specific lines in the code allows developers to pause the execution at those points. Developers can then examine the state of variables, step into functions or methods, step over lines of code, and resume execution.
- Step Into — This action enables developers to enter the execution of functions or methods called within the current line of code. It helps the developer to track the flow of execution and understand how functions affect the program.
- Step Over — With this action, developers can execute the current line of code without stepping into any function or method calls. It is useful when the focus is on the current block of code, and the developer does not want to delve into function details.
- Step Out — This action allows developers to quickly exit the current function or method and continue execution until reaching a new calling point. It is useful when developers want to skip the execution of internal function details.
When to Use PHP Step Debuggers
PHP step debuggers are particularly useful to understanding how the code flows. Complex applications with tons of PHP files and function calls are difficult to debug by traditional output or by monitoring error files. By stepping through the code, developers can deeply inspect the value of variables, evaluate expressions, detect issues in the logic, and understand the behavior of PHP applications. Additionally, some IDEs supply additional features, like using a conditional breakpoint that only stops when this condition is met, or overwriting the current value and testing it to understand the different behavior.
Limitations and Complications of Debugging PHP With Step Debuggers
As described above, step debuggers are very useful in some cases, but they do have some limitations for debugging PHP. Step debuggers:
- Do not allow you to obtain detailed information about the memory consumption and execution times of each individual call to function and code block defined in applications.
- Do not allow you to immediately obtain aggregate information about the number of times a function or code block has been executed.
- Do not allow you to obtain profiling information related to the execution of HTTP processes or the execution of queries and transactions performed against resources or databases.
In general, step debuggers cannot be used to obtain a snapshot, real-time or recorded, of your PHP app execution. It becomes more difficult to retrieve immediate information about memory and resource consumption, profiling performance, queries, or bottlenecks, making improving scalability of PHP applications difficult.
Finally, many step debuggers are not beginner friendly as they require you to install an extension like Xdebug. If you have never used Xdebug before, it might be hard to set up, as the extension must be activated on the server, followed by setting some configurations like "debug.mode" or "debug.start_with_request" and so on. You must also set up your IDE for the connection.
Back to topProduction Solutions for Debugging PHP
ZendHQ, the must-have extension for ZendPHP secure runtimes, is a Perforce solution designed to make debugging PHP easier while also monitoring and profiling PHP applications. It includes several features explicitly designed to help your team:
- Z-Ray — Z-Ray profiles your application, supplies metrics about memory resources, time performance, bottlenecks, application flow, and more.
- Monitoring — ZendHQ monitoring detects issues before they become problems.
- Code Tracing — ZendHQ Code Tracing quickly finds and fixes issues in your production apps.
ZendHQ easily supplies debugging metrics that traditional PHP debugging tools struggle to obtain, allowing interactions in production scenarios. In fact, Z-Ray is built to fill the gaps left by traditional debugging methods, making it easier to debug PHP and profile your PHP application in terms of performance, resource consumption, and more. The primary use cases for Z-Ray include:
- Identifying the Root Causes of Problems — Every Z-Ray request includes a full stack track of function calls made in the application. It also includes timing and memory usage information for those calls, allowing you to drill down to those that are the most expensive.
- Profiling Your Application — Z-Ray requests provide you with full timing and memory usage information, which you can use to proactively identify where adjustments are needed to improve performance.
- Understanding Application Flow — Z-Ray is extensible, and a number of plugins are included by default. These plugins generally trigger under specific conditions, such as identifying that a specific PHP framework or application is running. This information helps DevOps teams identify performance issues and work flows that lead to errors, as well as their root causes.
Back to topLearn More Debugging PHP With ZendHQ
More details about ZendHQ, Z-Ray, and other Zend PHP solutions are available on our portal. Can't find what you're looking for? Reach out and speak with an expert.
How to Debug PHP With ZendHQ and Z-Ray
While ZendHQ and Z-Ray simplify debugging PHP, they do require some steps to get started. Z-Ray requires that you enable tracking, and then make one or more requests to your PHP application that include a token. These requests are then captured in ZendHQ for you to inspect.
Activate Z-Ray
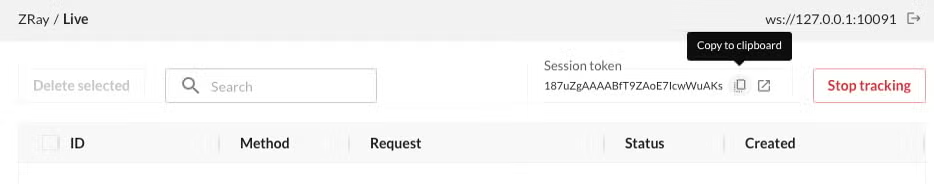
To use Z-Ray, navigate to the Z-Ray > Live navigation heading. As Z-Ray does not collect data by default, you must first select "Start Tracking."
The Z-Ray session ends after a time period of one day, when you close the ZendHQ User Interface, or when you select Stop Tracking. In order to track requests, you must include a Z-Ray session token.
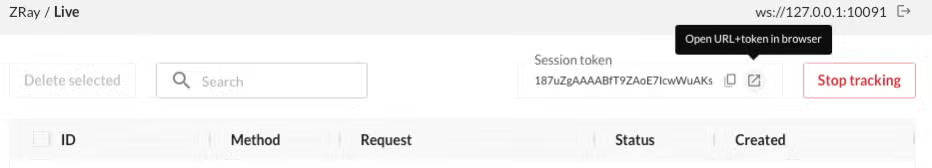
The token is available in a box immediately to the left of the tracking toggle button. You may either manually highlight and copy the token, use the button to copy to your system clipboard, or use the button that opens your application in a browser.
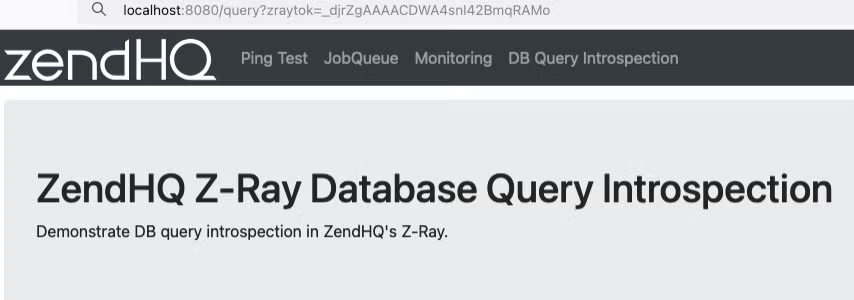
In the case where you copy the token, you need to include the token in a request to your application via either:
- A query string argument named "zraytok"
- A cookie named "zraytok"
In a browser, this may be accomplished by appending ?zraytok={TOKEN} to any url.
If you prefer to pass the token via the command line, you can include it via a query string argument. Examples with popular HTTP request tools include:
- cURL:
curl "https://example.org/some/page?zraktok={TOKEN}" - wget:
wget "https://example.org/some/page?zraktok={TOKEN}" - HTTPie:
https GET example.org/some/page zraytok=={TOKEN}
In a browser, you only need to include the token in the query string on the first request, as a cookie is set thereafter. For CLI tools, you need to include it in each request.
Viewing Z-Ray Events
Once you have started tracking and made one or more requests with the Z-Ray token, events appear in the Z-Ray > Live window.
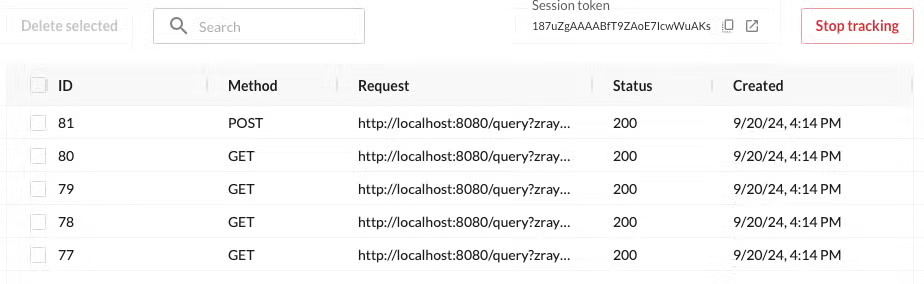
Clicking on a request provides a details pane that includes the HTTP method used, the URL, and the response status. Additionally, it includes a number of tabs. By default, the following tabs are always present:
- Info
- Request
- Variable
- Response
- Functions
Depending on the Z-Ray plugins you have installed, you may see additional tabs with more application information.
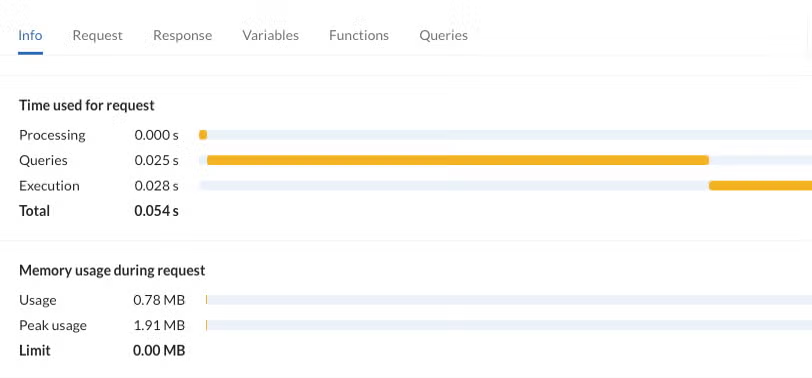
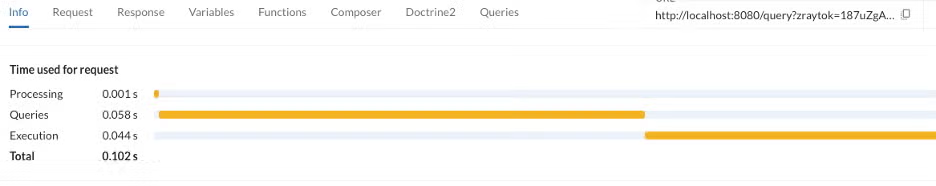
Info
Info provides aggregate statistics on CPU and memory usage, execution time, and the host that generated the event.
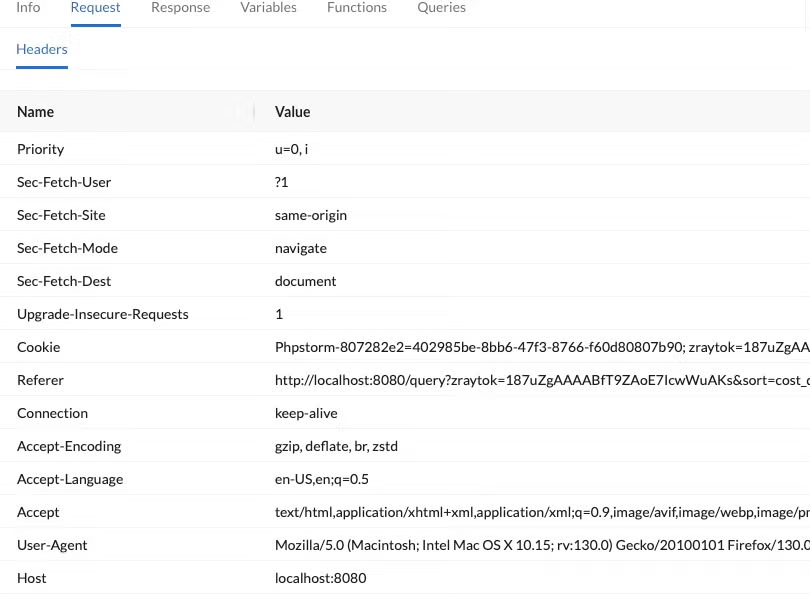
Request
Request provides information from the HTTP request, including headers and body content, if any.
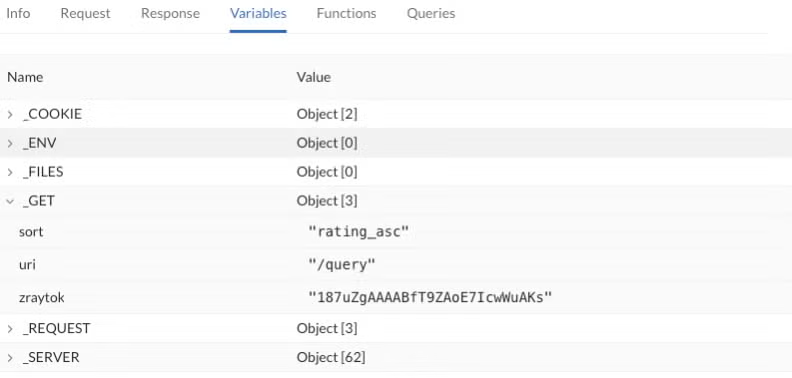
Variable
The Variable tab displays the values of the various PHP superglobals.
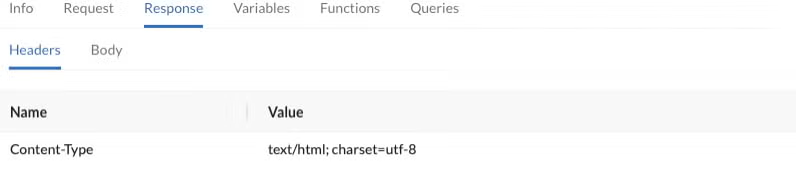
Response
The Response tab provides a list of all HTTP headers in the response, as well as the body content.
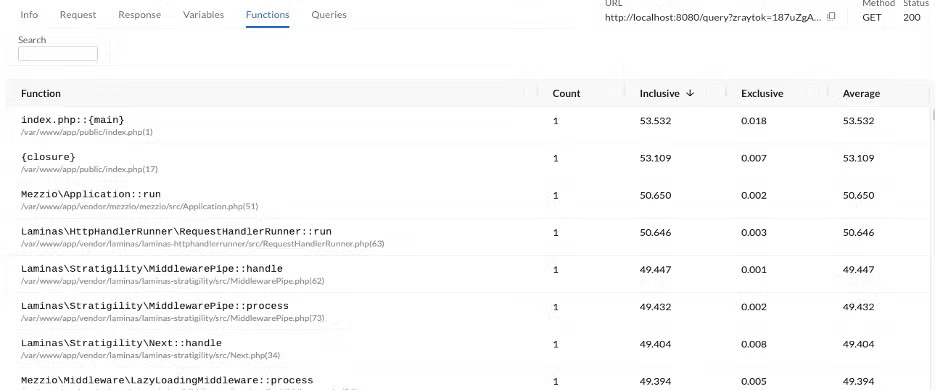
Functions
The Functions tab is very useful for understanding the flow of the PHP app. It supplies all the details for:
- How each function was called
- How many times the function was called
- Inclusive time (time spent executing the function and all functions it called internally, measured in milliseconds)
- Exclusive time (amount of processing time exclusive to the function itself, measured in milliseconds)
- Average time (to compute the total time a function was called)
- Where the function was defined (file and line number)
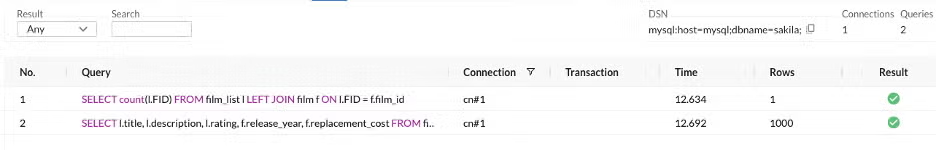
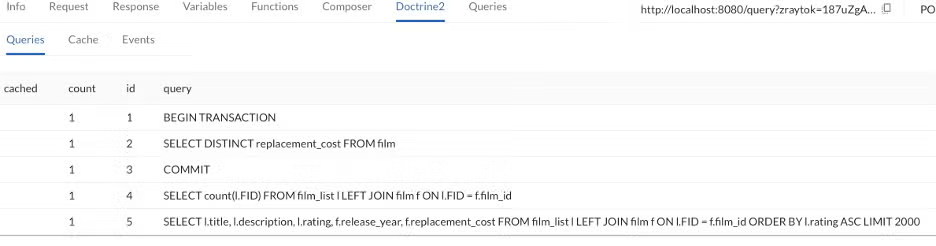
Z-Ray Events Database Query
Z-Ray provides the Queries tab for inspecting and profiling all database queries made in a request. Database query introspection gives your DevOps team a powerful tool for understanding what queries are occurring in production applications, how many are being performed, and the timings of each of them. This information will help your team understand query bottlenecks, allowing you to determine if you need to invest in better caching strategies, better indexes, or even better queries to improve application performance.
PDO databases are supported with transactions and supply the following information:
- Query string (displays string SQL syntax)
- Connection resource
- Transaction ID
- Execution time (in milliseconds)
- Number of rows
- Result of the query (success, failure)
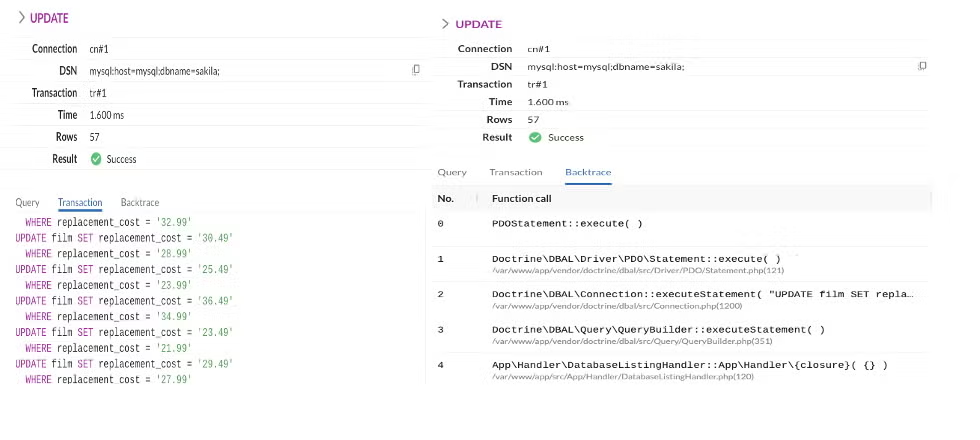
Clicking on any query opens a drawer that shows the full query. From there, you can view a backtrace of all the lines that happened within the PHP application before the query actually took place. Filters allow you to select a range of data, such as inspecting the result of a transaction process.
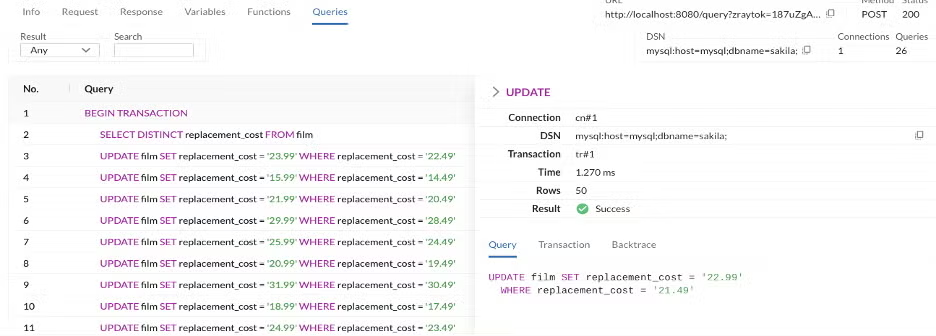
In the detail view, we supply all information aggregated by transactions, as well as the full backtrace.
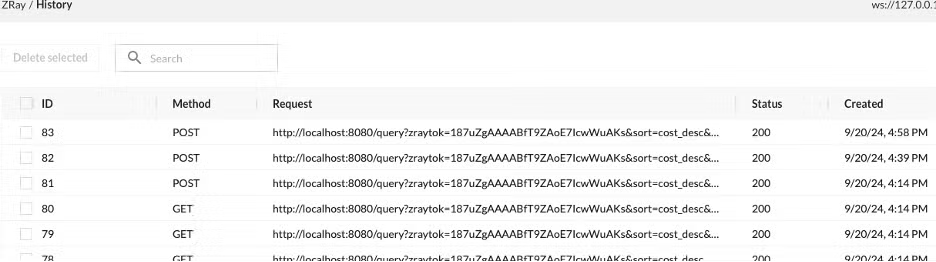
Historical Z-Ray Events
You may want to run several different Z-Ray sessions and compare the results between them. For example, you may want to see if timing has changed from a previous request. The Z-Ray History menu contains the list of all captured Z-Ray events and has the exact same views as the live log.
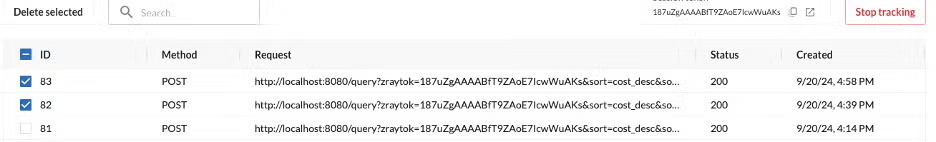
Deleting Z-Ray Events From the Live Log
If you wish to remove events from the live log (for example, you've started a new session, or you want to remove ones you've already examined), you can click the check box next to the request, and then select "Delete selected" at the top left of the live log.
Extending Z-Ray Through Plugins
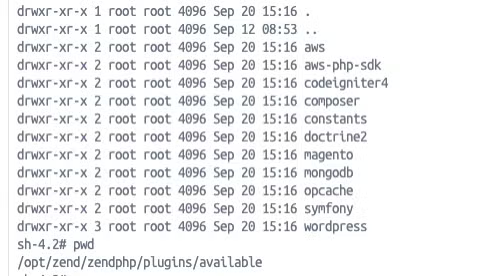
ZendHQ allows you to extend the capabilities of Z-Ray through a plugin system. It is a powerful feature for debugging PHP, allowing you to customize all your information. Z-Ray supports many plugins, including these options which are installable on ZendPHP runtimes:
- AWS plugin
- AWS-PHP-SDK plugin
- CodeIgniter 4 plugin
- Composer plugin
- Constants plugin
- Doctrine 2 plugin
- Magento plugin
- MongoDB plugin
- OPCache plugin
- Wordpress plugin
The plugins display details and custom metrics or information about the functionality used in your PHP application, but they must be installed and enabled:
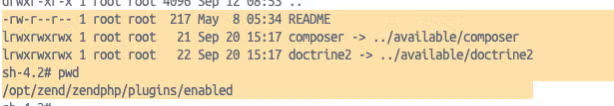
If Z-Ray detects a request from a plugin, a new tab will appear in the Z-Ray View Details menu.
By enabling a doctrine2 and composer plugin, Z-Ray will display two new tabs:
Every plugin could have one or more sub-tabs, each displaying information depending on libraries. They will supply more specific details for debugging PHP only when this function or code block is called. Developers are also able to write their own plugins to better monitor their code.
Creating New Plugins to Extend Z-Ray
ZendHQ Z-Ray allows you to define your own plugins to fit your needs, so long as they are written in PHP. Creating a Z-Ray plugin is simple and consists of:
- Create a new directory in the plugin folder of ZendHQ
- Create file
zray.php
Internally, the zray.php will create an instance of the class ZRayPlugin, and configure it to trace one or more functions. The ZRayPlugin class API is as follows:
final class ZRayPlugin
{
                  public function __construct(string $namespace, bool $enabled = false) {}
                  public function traceFunction(string $funcName, ?callable $enterFunc, ?callable $leaveFunc): bool {}
                  public function untraceFunction(string $funcName): bool {}
                  public function hasTraceFunction(string $funcName): bool {}
                  public function setEnabledAfter(string $funcName): void {}
                  public function setEnabled(bool $enable = true): void {}
                  public function isEnabled(): bool {}
}
A typical plugin file generally instantiates the ZRayPlugin instance with the name of the plugin, and either enables it universally (via the flag to the constructor, or by calling setEnabled()) or via a setEnabledAfter() call. In order to do anything of value, it will need to also call traceFunction().
For more details and further information, visit our ZendHQ Online Documentation.
Interaction Between Z-Ray and Monitor Code Tracing
To support the metrics provided by Z-Ray with ZendHQ, the monitoring dashboard provides additional insight on the status of the request being inspected by Z-Ray.
In general, without going into too much depth, PHP application monitoring provides notifications when certain conditions occur (an event is triggered), such as high CPU usage, high memory usage, slow requests, slow query execution, or other issues. They are tracked by configuring and defining a monitoring rule level.
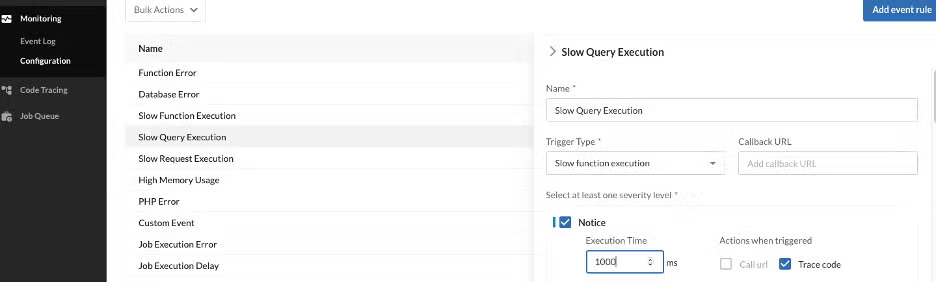
Whenever a monitoring rule is created, it generates an event containing the information to be collected by the monitoring rules. Events are then displayed in the Event Log section of the Monitoring navigation menu. By defining a monitoring event rule, you can also choose to use Code Tracing. Then, when an event is triggered, the ZendHQ extension captures a code trace and sends it to your ZendHQ node.
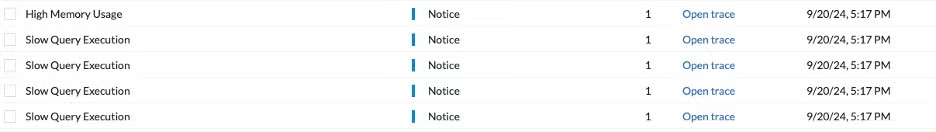
Code Tracing provides a tree of all function calls made in a request, including timing, memory usage, function arguments, return values, and much more. It allows you to determine the context of why an event was triggered, which you can then use to diagnose an issue in production.
Viewing a trace allows you to investigate by:
- Time threshold
- Memory threshold
- Error
- Searching for specific errors
- Searching for specific keywords
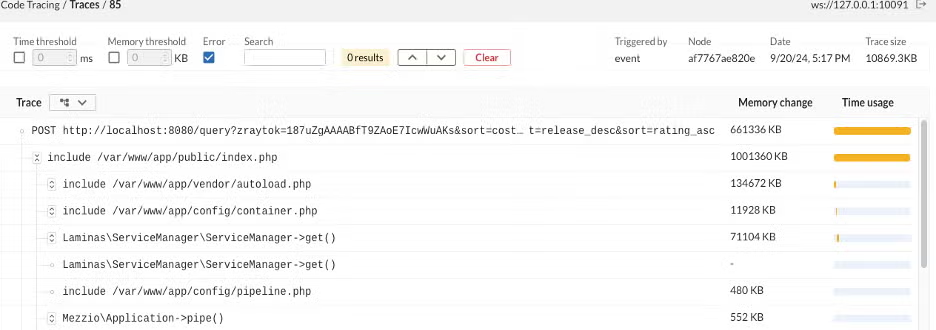
This may be done to profile an application to determine where performance bottlenecks occur and could integrate with Z-Ray result inspection to have a complete overview on what happened during the execution of your PHP application.
Back to topFinal Thoughts
Z-Ray, a powerful part of ZendHQ, is a solution that goes beyond traditional tools for debugging PHP by focusing on the performance and scalability aspects of your applications. It becomes an important tool for helping your DevOps or Platform Engineering teams address fundamental issues.
In addition to being a powerful method for debugging PHP, Z-Ray is a diagnostic tool to use in production and other situations where traditional debugging could be a problem. It detects issues before they impact usability, and it is very configurable to minimize false positives. Ready to step up your debugging PHP processes? Get started with ZendHQ and Z-Ray today!
Try ZendHQ Free for 21 Days
Ready to discover what ZendHQ and ZendPHP secure runtimes can do for your infrastructure and PHP debugging processes? Try both free for 21 days — no commitment required.
Additional Resources
- Free Demo - ZendHQ
- On-Demand Webinar - PHP Observability and Orchestration With ZendHQ
- On-Demand Webinar - Optimizing PHP Apps to Gain a Competitive Edge
- Blog - PHP Code Tracing With ZendPHP and ZendHQ
- Blog - Exploring ZendHQ Database Query Introspection
- Blog - PHP Errors: How to Find and Fix PHP Errors in Production
- Blog - Why Good PHP Monitoring Matters
- Blog - How to Connect PHP and PostgreSQL
- Blog - PHP Logging: Best Practices for PHP Log Analysis
- Blog - PHP Maintenance and Tech Debt: 2025 Trends